Skip to content
Site icon: MSI dragon shield branding
MSI Afterburner Guide

msiafterburner.io · reader-first

A calmer way to read your GPU. Then change one thing at a time

Afterburner is a capable panel for clocks, limits, and sensors. This site explains how to avoid the usual traps: grey sliders after a messy driver swap, fan curves that hunt, overlays that vanish, and profiles that load before you meant them to.

Scope

What these pages actually unpack

Everything below stays out of the hero on purpose: it is the slower map for when you already know why you opened Afterburner and need a place to land without rereading marketing copy.

Afterburner is a bundle of habits: graphs, profiles, companion tools, and the patience to undo a bad afternoon. The blocks below map how we group writing here so you can jump without losing the thread.

Nothing here replaces vendor documentation: it translates it into checklists: what to verify first, what to log, and what to revert when a session goes sideways.

Use the four cards as a map, not a to-do list in one sitting: profiles first when behaviour is “wrong at boot,” thermals when noise or temps lie, limits when clocks flatten under load, overlays when pacing feels off in one title only.

Pre-flight

Three guardrails before offsets

Treat the trio below as a pre-flight list: if you cannot answer “what did I measure?” or “what is my undo?” you are not ready to chase another +15 MHz.

The numbers are labels, not scores: 01 is about evidence, 02 is about discipline, 03 is about recovery. Skip any step and the next session becomes guesswork.

01

Measure before you chase MHz

02

One axis per experiment

03

Keep a rollback story

You can memorise the trio in under a minute; the hard part is refusing to violate them when a leaderboard screenshot makes you impatient.

Those three lines are not a personality test: they are guardrails. When a thread tells you to “max everything,” come back here and pick one knob to move, one metric to watch, and one way to undo it.

If you cannot describe the change in one sentence, you probably moved two things at once. Split the session, restore the baseline, and try again with a narrower question.

Print-screen the trio or paste it into your notes file: the goal is not memorisation, it is having a boring anchor when a new driver drops mid-season and every thread suddenly disagrees with last week.

When the trio feels obvious, that is the moment you are most likely to skip step 02. Come back after the crash, export a profile, and admit which two knobs moved in the same minute.

Why this exists

Different from random forum screenshots

Threads are great for sparks, terrible for memory. These articles are written so you can reopen them after a driver branch change and still follow the intent.

The two columns below split intent: one lists what we optimize for when wording gets long, the other lists what we refuse to imply because it ages badly and wastes your evening.

Read the left column as “how we earn your time,” the right as “what we will not pretend is universal”. Both exist so you can spot wishful thinking before it costs you an evening of driver archaeology.

What we optimize for

Clear vocabulary, repeatable checklists, and honest limits: laptops, OEM firmware, and anti-cheat rules still exist after you read a headline about “free FPS.”

When a guide says “your mileage may vary,” we try to name the variables: case volume, VBIOS behaviour, Windows power plans, and whether another vendor tool still owns part of the fan stack.

We bias toward reproducible steps because “it worked on my rig” is not a transfer protocol. Your room temperature and background processes are part of the experiment whether you write them down or not.

What we skip

We do not promise lottery silicon, bypass competitive rules, or pretend a slider replaces PSU capacity. If a knob is unsafe for your comfort level, we say so plainly.

We also skip “secret registry hacks” and one-click optimizers. Not because curiosity is bad, but because unlogged magic is impossible to unwind when a driver update lands mid-season.

If you need edge behaviour, document it like a lab note: hypothesis, single change, measurement window, rollback. Then you can share it without turning your PC into folklore.

When columns feel preachy, zoom out: both sides exist so you do not mistake “clear writing” for “permission to ignore thermals, firmware limits, or the fact that your case is not a wind tunnel.”

Below is the same story from four angles: monitoring discipline, fan shape, power limits, and overlays. You do not need to “finish” all four before dinner; you need one honest match to your current symptom.

Each tile is a doorway into a longer article: use it to name the story you are in (graphs, noise, limits, or overlays) before you open every guide on the site.

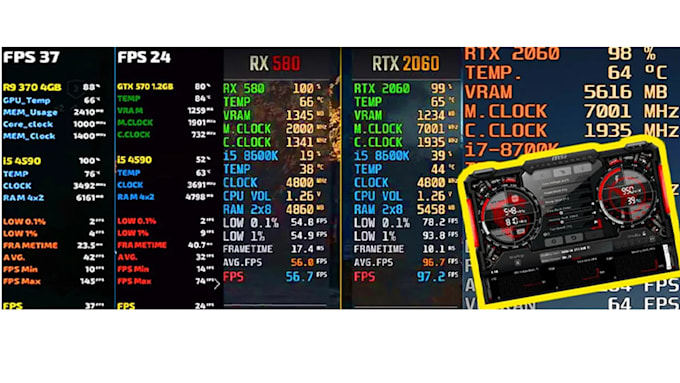
LAN-style hardware monitoring dashboard screenshot

Remote-style monitoring mindset

Treat graphs as contracts: if power limit time is high, chasing core offset alone is theater. Learn which sensors actually move when you play.

Logging one busy scene twice: before and after a change: beats staring at a static curve you copied from a stranger’s screenshot.

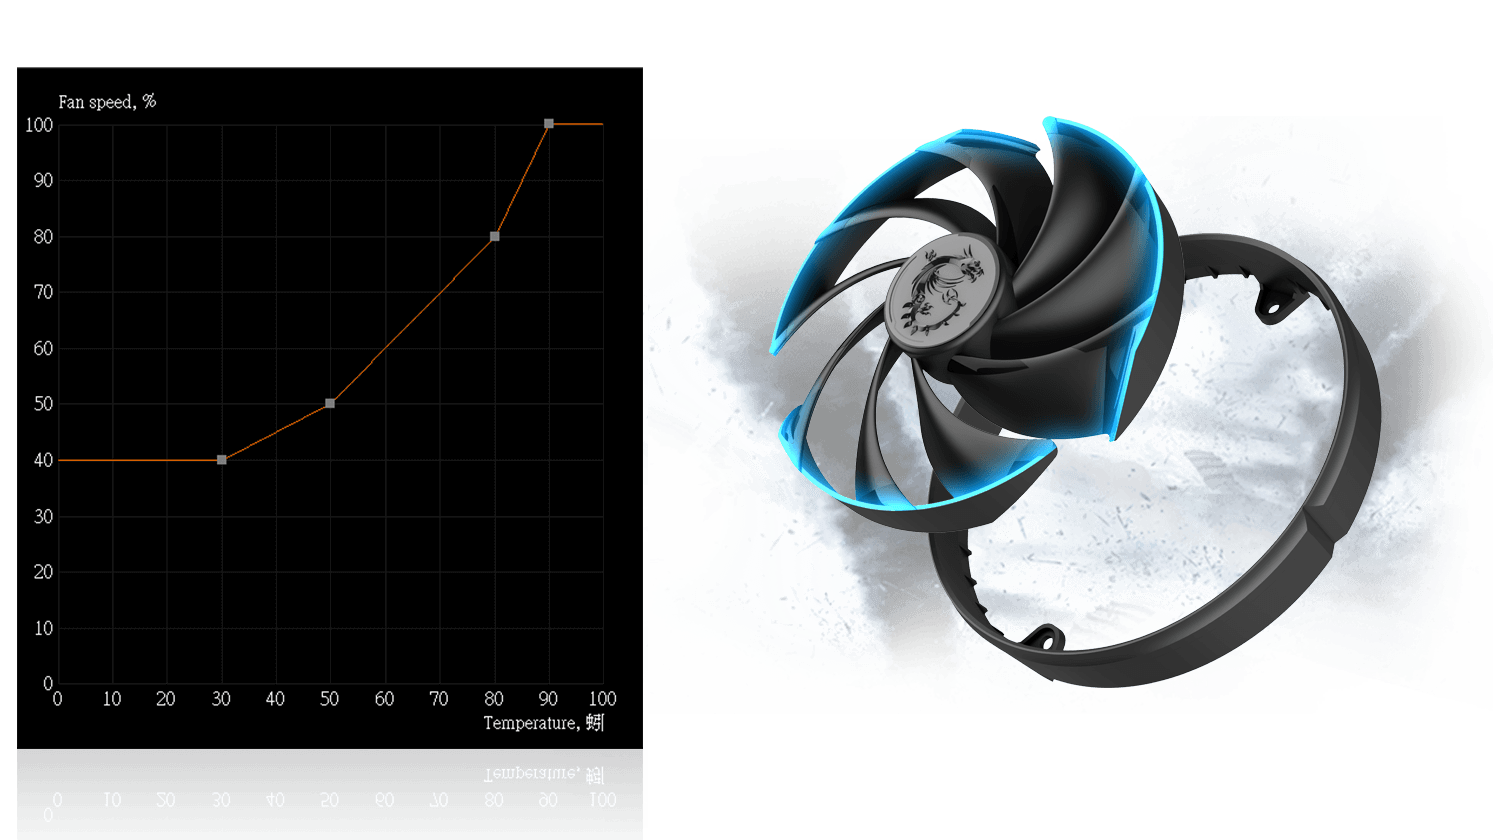
Fan curve editor interface in MSI Afterburner

Fan shapes that behave

Gentle slopes beat stair-steps near the temperature band you actually sit in. The goal is fewer audible reversals, not a pretty zigzag.

Hysteresis is not “advanced”: it is politeness for your ears when the die hovers near a breakpoint for minutes at a time.

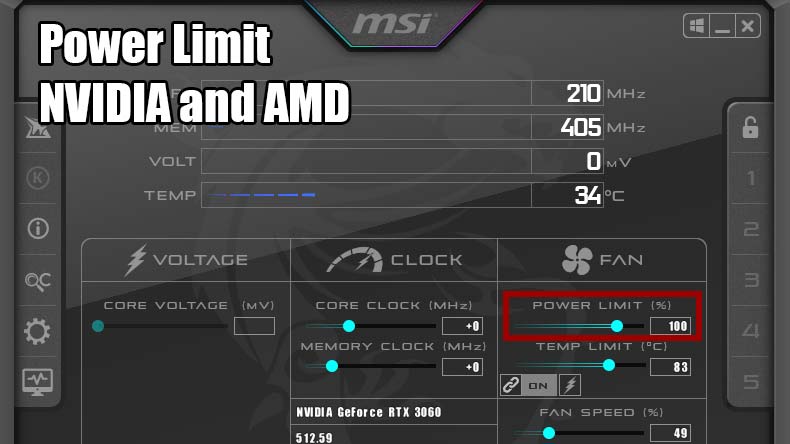
MSI Afterburner power limit slider screen

Power limits without mysticism

Raising a ceiling reallocates budget; it does not invent cooling. Pair limit changes with intake sanity and a short real-game validation pass.

If hotspot climbs while edge stays flat, think contact and case flow before you chase another +50 MHz headline.

Custom on-screen FPS overlay preview

Overlays as diagnostics

RTSS-style overlays are for pacing questions, not flex screenshots. Start small: FPS, frametime, one temperature field, then add.

Cap the number of live fields the way you cap browser tabs. Each new line is another claim your eyes must defend under stress.

Field notes · msiafterburner.io

Longer reads

Start with one bookmark, not ten tabs

Each article is written to survive a driver branch change. Open one, follow it in order, then close the extras. Your future self is the audience.

If you bounce between OC Scanner, undervolting, and detection triage in one evening, you will lose the plot. Finish one thread, export a profile, sleep, then pick the next topic with a clean log.

Treat the cards as a queue, not a buffet: OC Scanner when you have working controls and want a draft curve, undervolting when thermals and stability trade space, detection when the UI will not attach to the GPU at all.

Before you open a card, name the symptom in one clause. “fans hunt at 58°C,” “Scanner curve ignores power limit,” “grey sliders after DDU”. That clause decides which article earns the first hour.

Open one card, finish it, export or screenshot your baseline. The other two will still be here tomorrow, and your log file will not lie about which guide you actually followed.

MSI Afterburner promotional-style still used as the OC Scanner guide hero image

OC Scanner in plain language

What the tool is trying to infer, what it cannot see, and how to sanity-check results with a short manual pass before you bake offsets into a startup profile.

Treat OC Scanner output as a draft curve: validate with the same game loop you actually care about, not a five-minute menu tour.

Read the OC Scanner guide
MSI Afterburner interface showing power limit and related controls

Undervolting without fairy tales

Why a lower voltage curve can still crash, how to watch power-limit headroom, and when to stop tuning and declare a stable envelope for the week ahead.

Stability is a calendar problem: a curve that survives tonight’s session still has to survive tomorrow’s driver background task and next week’s Windows update cadence.

Read the undervolting article
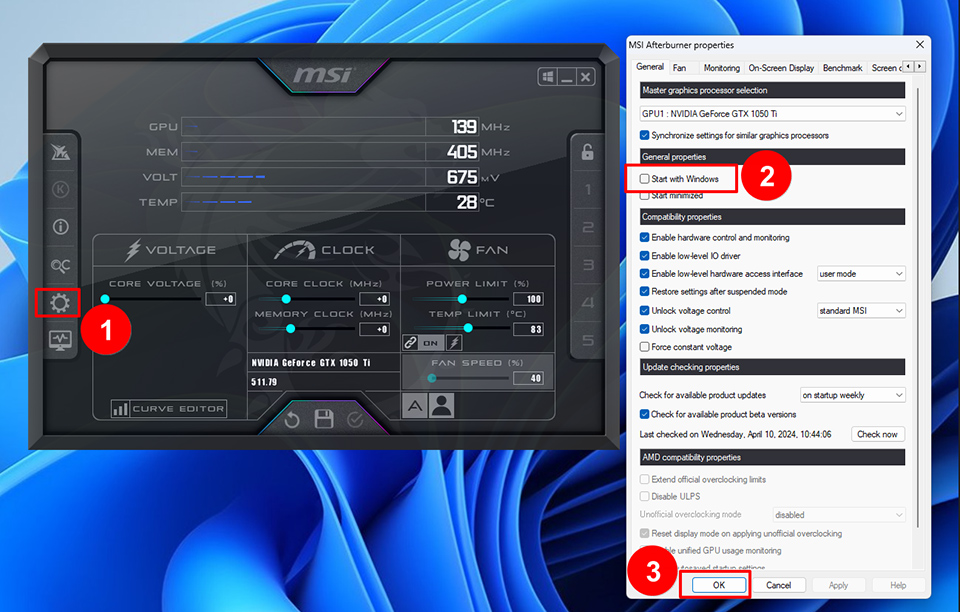
Tutorial-style screenshot with numbered steps for Afterburner settings and Windows startup options

Startup, detection, and grey sliders

Ordered triage for clean installs, residual control-panel conflicts, and the boring fixes that restore detection before you reinstall an entire OS image.

Grey sliders are often politics between competing control layers. The article lists the usual suspects in the order that wastes the least evening.

Read the startup checklist

Vocabulary

Words that keep you honest in the UI

Use the grid as a decoder ring: when a forum post drops three acronyms in one sentence, find the matching row here first. It turns noise into “which line on the graph should move next.”

Same labels show up in forums, release notes, and panic searches. Here is the short version we use consistently across articles so you can map what you read to what you see.

When two terms argue on-screen. For example power limit time high but voltage reported low. The glossary entries are hints about which graph to trust next, not an invitation to drag every slider at once.

Skim the grid once for shape, then keep one term pinned in your head during the next gaming session. Definitions stick when they predict a line that moves, not when you reread them at 2 a.m.

Power limit %
A ceiling on how much electrical budget the GPU may draw averaged over a window. Raising it reallocates headroom; it does not add millimeters of cooler fin area.
Temp limit
A thermal guardrail that can pull clocks down when the die crosses a policy line. It interacts with fan curves and case airflow. Treat it as part of a system, not a single knob.
Voltage curve / VF curve
A relationship between requested frequency and delivered voltage. Flat spots and cliffs explain stability better than a single “max MHz” screenshot.
Memory offset
VRAM timing margin expressed as a delta. Shader-heavy titles sometimes trip here before core-only stress loops ever complain.
Fan curve vs. hysteresis
The curve maps temperature to duty; hysteresis is the intentional delay that stops rapid toggling when you hover near a breakpoint.
On-screen display (OSD)
A transparent telemetry strip over games. It is a measurement instrument first. Add fields only when each answers a question you can state out loud.
Perfcap / reason flags
Short labels that explain what limiter won the budget fight last frame. Power, thermal, voltage, or utilisation. They are more informative than a single FPS number when clocks look “wrong.”
Profile slot vs. disk file
The UI slot is a pointer; the file on disk is the truth. Export copies before experiments so a mis-click does not erase a week of careful tuning.

When a term still feels abstract, open Afterburner beside this list and watch the label move during a short load. Vocabulary sticks faster when it is tied to a wiggling graph, not a definition in isolation.

Still stuck after the grid? That is normal: jargon is dense. Pick one unknown word from your last crash log, search it here, then re-open the FAQ with that word pinned in your head.

When the grid stops helping, switch tools: export the profile, grab one monitoring screenshot under a real load, and open the FAQ with that image. Vocabulary plus evidence beats vocabulary plus panic.

Field notes

Composite field notes (illustrative)

The quotes below are short patterns. Useful for matching symptoms, not for copying MHz. Read them like shop notes (“what we see in the bay”), not like a leaderboard.

Anonymized patterns only: not testimonials, not guarantees.

If one vignette fits, borrow the shape of the fix: what changed first, what you held constant, and what you rolled back. Do not copy clock numbers from another GPU and cooler.

Each line compresses a lot of forum noise. Your next step is one clear measurement. Not five sliders moved at once.

Memory offset

“Shader-heavy titles crashed while short loops looked fine. Backing off VRAM first fixed nights that core-only tweaks never touched.”

Fan hunting

“Two steep steps around 62°C made fans yo-yo. Smoothing that band mattered more than another +30 MHz headline.”

Driver residue

“Grey controls until a clean reinstall wasn’t glamorous, but it beat reinstalling Windows on a Tuesday.”

Between the cards is where intuition lives; below them is the reminder that stories age while silicon and drivers keep moving.

Physics and software stacks repeat the same boring stories. Your exact numbers will differ. Use these as nudges to read the graph sideways, not as promises.

If none of the three fit, treat that as signal: you may be in a rarer stack fight. The detection article’s ordered ladder beats random offset tweaks.

When a line stings, add one note: what you will not change this week. Constraints turn vignettes into checklists instead of MHz shopping lists.

External video picks (opens YouTube)

Video is great for UI muscle memory and terrible for “my card is different” arguments. Treat each clip as a demo of where menus live, not as a universal recipe for your exact silicon lottery.

Use these as orientation, then verify against your GPU generation and driver branch.

Thumbnails are local stills; playback happens on YouTube in a new tab.

Pick a video that matches your stack generation and UI language. A beautiful walkthrough on the wrong driver branch can still send you chasing ghosts.

YouTube

Prefer creators who show driver branch strings, monitoring strips, and a repeatable scene loop. If a clip only shows peak MHz in a menu, treat it as entertainment. Not a tuning procedure you can copy safely.

Pause the video when they zoom the graph: note which sensors are pinned, which are idle, and whether the presenter names the limiter. That freeze-frame is often worth more than the commentary track.

After you pick a clip, pause on the first full-screen of the monitoring strip. If the presenter never names power or thermal headroom, treat the rest as UI tourism, not tuning doctrine.

After you watch, try one takeaway in software: a single graph field enabled, one fan breakpoint softened, or one profile export. So the tab becomes a bookmark with muscle memory, not just entertainment.

If a thumbnail promises “secret settings,” assume marketing. The useful clips still show mundane menus with honest limiter language.

Still reading

Two more guides worth the scroll

These two long reads reward patience: they assume you will actually move sliders, read graphs, and undo when the room gets hot. Not just collect tabs for moral support.

Fan shape and overlay timing reward slow reading: the headline tweak is rarely where the bug lives. These posts go step-by-step so you can match behaviour to cause.

Both guides assume you already have a stable driver baseline. If you are mid-triage after an update, finish the detection article first. Fan and overlay work is miserable while the control stack is half-registered.

Skim the fan-curve piece before you buy paste “just in case”: many hunting problems are curve geometry, not interface material. Paste is the expensive guess.

The two deep dives pair well with a quiet evening: fan work first if the PC sounds alive when the GPU is barely busy; overlay timing first if stutter feels worse than averages suggest.

Fan curve editor interface in MSI Afterburner

Fan curves and thermal targets

How to pick breakpoints where you actually live in-game, soften stair-steps, and stop hunting near idle without sacrificing headroom when a summer heatwave hits.

Open the fan-curve article
Custom on-screen FPS overlay preview

RTSS, scanlines, and pacing

Why frametime fields matter, how sync families interact with overlays, and how to keep the OSD from becoming noise you stop trusting.

Open the RTSS scanline piece

The two cards below are long reads on purpose. Skim the headings, then commit to one article’s checklist before you cross-link yourself into three half-finished tabs.

If you are comparing Afterburner to vendor tools or wondering what is safe to stack, the alternatives article names trade-offs bluntly. No league-bypass fantasy, no universal “best” stack.

When both guides tempt you at once, choose fan work if the machine sounds wrong at idle-to-light load; choose RTSS if pacing feels “off” while averages still look fine on paper.

Alternatives matter when two tools both think they own fan duty. Read that piece before you stack installers “just to compare.”

Reading the strip

When sensors tell different stories

Afterburner is honest about what it can sample; your job is to decide which line answers the question you actually asked. Not which line makes the chart look busy.

Power-limit time, thermal headroom, and voltage reporting can disagree for minutes while the system is still “fine.” That overlap is normal physics and driver policy, not a personal attack on your tuning skills.

PerfCap and reason-style labels exist to break ties: they name the limiter that won last frame. When they flip rapidly, widen your time window. A one-second spike is noise; a five-minute plateau is a decision.

Before you change another offset, write the symptom as a sentence a stranger could reproduce: load type, duration, ambient ballpark, and which field moved first. That sentence picks the next graph better than hope.

Same scene, two windows

Compare a short loop twice with the same camera path and similar background apps. If only one metric moved, you have a lever; if everything moved, you have environment noise or a second tool still touching clocks.

Trust order, not ego

When core clock looks “stuck” but power headroom is empty, chasing MHz first is theater. When thermals climb but power limit stays flat, think airflow and case pressure before you blame the silicon lottery.

Logging beats screenshots

A single screenshot is a postcard; a short log or two timed captures is a diary. Diaries survive the question your future self asks three Tuesdays from now: “what did I actually change before the regression?”

If two graphs contradict each other, assume both are true under different time constants. Pick the slower one as your governor for the evening and treat the fast one as early warning, not as marching orders.

When you are tired, default to one field you can explain out loud. If you cannot, remove it from the overlay until you can. Sparse telemetry ages better than a Christmas tree of numbers you stopped reading.

Session discipline

Habits that survive driver Tuesday

The UI will move between versions; the habits below are what let you reopen a profile six months later and still know why it exists.

Name files like a lab notebook: date, GPU model shorthand, driver branch string, and “before” vs “after.” Future-you searches folders faster than future-you remembers vibes.

Pair every experimental profile with one exported baseline on disk. Not cloud-only, not chat-only. Disks do not gaslight you when a forum thread deletes itself.

When a Windows or driver update lands mid-season, rerun the shortest validation loop you trust before you declare regression: same game scene, same duration, same room temperature band if you can manage it.

FAQ first for breakage

Grey sliders, missing GPU names, and startup-order fights show up in the FAQ as ordered questions. Use that ladder before you stack random reinstall advice from five tabs.

Blog for shape and theory

Long articles are for when you have an hour and a stable baseline. Fan geometry, overlay pacing, undervolting envelopes. Do not start there at 1 a.m. on a half-detected stack; finish detection hygiene first.

Close sessions with one line in your notes: what still feels wrong in plain language. “Weird stutter in menus only” beats “tried stuff” when you reopen the FAQ next week. Searchable beats heroic.

Companion stack

Tools beside Afterburner: without doubling control

Afterburner is the panel you tune in; other utilities answer adjacent questions. The trick is knowing which program owns which lever so two apps do not fight the same fan contract.

RTSS-style overlays, vendor telemetry, and motherboard utilities can all be innocent. And they can all move the goalposts if each thinks it should win the last word on fans or power behaviour.

Treat installs like a stack diagram: capture hooks, fan policy owners, and RGB software that insists on kernel-ish helpers. If two layers both claim “smart fan control,” expect hunting before you blame paste.

Before you add another tray icon, ask what question it answers that Afterburner already answers poorly. If the answer is “none,” skip the install and keep the baseline cleaner.

Overlays and pacing

Keep overlay fields tied to questions you can say out loud: frametime variance, power-limit time under a named scene, one temperature you actually care about. Everything else is decoration that ages into distrust.

Logging and exports

Profiles on disk and short notes beat memory when a driver branch reorders startup. Export before experiments; screenshot the strip after meaningful load. Those files are your rollback story in portable form.

Vendor panels in parallel

Sometimes the motherboard tool or GPU vendor suite still owns part of the fan map. Document who wins before you tune. “Afterburner owns curve, suite owns zero-fan floor” is a sentence worth writing down.

If behaviour changes the day you installed a second tuner, uninstall or disable one layer at a time and re-measure. Parallel control is a hypothesis you can test, not a mystery you have to endure.

When in doubt, return to one owner for fans during troubleshooting, then reintroduce helpers one at a time with a log line each. Boring procedure beats a weekend of overlapping automation.

Hard ceilings

Limits you did not invent in Afterburner

Some walls are soldered into VBIOS policy, laptop firmware, or board power design. The UI can show a slider; physics and OEM rules still get a veto.

Mobile and small-form-factor machines often ship with tighter envelopes than open-air desktop reviews imply. Compare against your own chassis and PSU story, not against a stranger’s screenshot from a wind-tunnel bench.

OEM vbios and driver branches can cap behaviour in ways the marketing box never printed. When a slider stops doing anything, assume policy before you assume “broken install”. Then verify with the FAQ ladder.

Warranty and corporate fleet rules exist outside this site’s copy. When guidance here conflicts with a sticker on your machine, the sticker wins. Treat our articles as habits for personal rigs you are allowed to tune.

Laptop vs. desktop honesty

Same app name, different physics: exhaust paths, shared heatpipes, and firmware fan tables can make “copy this curve” advice nonsensical. Start from idle-to-load behaviour on your actual machine.

When sliders lie

Grey or stuck controls usually mean another layer owns the contract. Detection articles walk the ordered checks. Random registry folklore without a rollback path is the expensive kind of curiosity.

Respect the ceiling you measure, not the ceiling you wish for: export, change one variable, read the graph. If nothing moves, you have learned something about policy, not about your willingness to try harder.

Session review

After you close the game: before you forget

The useful data is often in the ten minutes after you quit: temperatures falling, fans spinning down, and whether the machine idles like it did yesterday. That window is cheap to observe and expensive to reconstruct from memory.

Treat shutdown like a tiny post-mortem: one monitoring strip screenshot, one line in notes about what still felt wrong, and whether you changed exactly one axis this session.

If you only captured peak numbers in the menu, you may have optimized for theatre. Menu peaks lie about sustained behaviour. Your game loop is the witness you actually need.

When nothing looked wrong but you still feel uneasy, that is data too. Write the vague symptom in plain language so next week’s you can search the FAQ without inventing new vocabulary from scratch.

Thermal tail

Watch how long hotspots take to relax after load stops. A slow tail sometimes means case recirculation or background tasks keeping the die warm. Not always “needs more paste tonight.”

Fan spin-down

Hunting at idle after gaming often traces to curve breakpoints or competing control layers. Note whether duty settles or oscillates. Oscillation is a geometry problem more often than a hardware fault.

Profile honesty

If you saved a profile mid-experiment, rename it so “draft” does not masquerade as “stable.” Future-you opens filenames before contents. Kindness to future-you is part of tuning hygiene.

When the session felt productive but the graph disagrees, trust the graph and adjust the story you tell yourself. Narratives age; logged lines do not.

If you are too tired to write a note, at least export the profile and park it beside yesterday’s copy. Tired you still deserves a rollback path.

How to read this site

Editorial habits, not headline promises

Articles here are written to be reopened after patches and driver branches. We bias toward checklists, plain-language symptoms, and explicit “stop here” lines when a path gets unsafe or unknowable from a browser tab.

We link outward for binaries and publisher truth. This domain is for habits, vocabulary, and triage order. If a paragraph ages because a vendor renamed a menu, the structure of the checklist should still help.

When copy disagrees with a forum consensus, assume both might be true under different stacks. Export your profile, change one variable, and let your measured loop pick the winner instead of letting momentum pick it for you.

Nothing here replaces MSI documentation, GPU vendor guidance, or your local warranty terms. It sits beside them as a reader-first map so you spend fewer midnight hours guessing which knob mattered.

FAQ vs. long articles

Use the FAQ when something is broken or half-detected tonight; use blog posts when you have a stable baseline and want theory, geometry, or pacing detail. Mixing the two at 2 a.m. usually creates three half-finished tabs.

Images and thumbnails

Screenshots illustrate behaviour and menu locations: they are not proof your silicon matches a stranger’s lottery ticket. Match generation, driver branch, and load type before you copy numbers.

If a section feels slow, that is intentional: the expensive mistakes on this topic are rushed installs, rushed curves, and rushed posts without a strip that shows limiter language. Patience here buys cheaper Tuesdays later.

Capture & overlays

When recording software shares the same evening as tuning

Capture hooks, game mode overlays, and RTSS-style telemetry can all be innocent. And they can all change frametime or GPU scheduling enough to fake a “regression” that is really a second layer waking up mid-session.

Treat capture like another variable in the experiment: baseline with it off, repeat the same loop with it on, then decide whether the strip you are reading is answering the GPU or the hook.

If stutter appears only while streaming or recording, suspect encode load and PCIe copy paths before you rebuild a global profile for every title. Narrow the reproduction first.

When two tools both draw on top of the game, disable one at a time and keep the scene identical. “same corner, same camera path, same sixty seconds” is enough to attribute motion to a layer instead of to silicon.

Baseline order

Validate thermals and limits with capture off first. Once clocks behave, add encode and re-check the same strip. You want a clean before/after story, not two myths stacked in the same minute.

Bitrate vs. headroom

High encode settings can move power and thermals enough to trip different limiters than your offline loop. Name the preset in your notes next to the profile name. Presets are part of the stack.

Fullscreen edge cases

Exclusive vs. borderless paths interact with overlays differently. If advice assumes one mode and you live in the other, expect different pacing. Log which mode you used beside every screenshot.

When capture is essential for your workflow, design one “broadcast profile” with fewer moving sliders and a wider stability margin. Performance streaming and fragile midnight offsets rarely share the same envelope.

If disabling capture fixes the symptom but you still need it on, read the FAQ’s overlay and hook language next. Vocabulary plus a reproducible loop beats guessing which installer owns the frame.

Posting for help

Screenshots that actually help strangers help you

Forums move faster when the strip tells a story: limiter language, driver branch, and a repeatable scene. The goal is evidence a stranger can pattern-match without guessing your entire PC from vibes.

Crop or blur serial numbers, license keys, and account emails. They rarely change the diagnosis but they do change your risk profile when a thumbnail gets mirrored across aggregators.

Include one full-width monitoring strip and name the game + graphics API if you know it. “DX12, same corner, two minutes” beats a menu MHz flex that hides the limiter story.

Say what you already tried in one short list: reinstall order, which control panels were removed, and whether the issue follows one title. That list prevents well-meaning people from rerunning your first hour.

Redact before upload

Treat every public screenshot like a postcard to the whole internet: keep windows, paths, and personal folders out of frame when they are not part of the bug. Curiosity scales faster than context.

Ask one question

Multi-paragraph rants with six questions get six half-answers. Lead with the single behaviour you want explained. Clocks, thermals, or pacing: and attach the strip that matches that question.

When nobody replies, assume your post needed narrower evidence, not louder tone. A tighter screenshot pair and a driver string often unlock the thread your first draft could not.

Download hygiene

Treat installers like airport security: dull checks beat “first green button” regret when SmartScreen names a publisher you do not recognise.

Get the real installer: not repack roulette

After download

  1. 1Use the publisher or GPU vendor channel you already trust. Not mystery mirrors.
  2. 2Confirm size roughly matches expectations; keep the installer until the build feels stable.
  3. 3Install, reboot if prompted, open Afterburner before games. Prove detection before overlays.
  4. 4Export a baseline profile before tuning so you can undo late-night slider experiments.

Treat bundled “drivers + optimizers” downloads with skepticism. They are often not Afterburner itself. Point people to this hygiene section instead of forwarding mystery files. Keep the installer through at least one real game session so file metadata stays comparable if something regresses.

Still unsure? Use the checklist in FAQ: cheaper than a reinstall spiral.

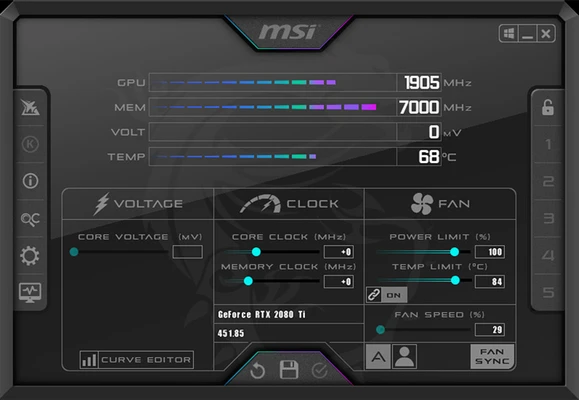
MSI Afterburner window with GPU power limit and sensor readouts. Typical screen after a genuine install

A good first launch looks boring: GPU name resolves, sensors move under load, you can save a profile. If not, grab the monitoring strip before uninstall sprees.

Download